Follow the Money: Categories of Consumer Spend
Where Are People Spending Money, and What Can We Learn From It?
Weekly writing about how technology shapes humanity and vice versa. If you haven’t subscribed, join 50,000 weekly readers by subscribing here:
Hey Everyone 👋 ,
Thanks for joining us in the Digital Native Discord community, launched last week. We’re 1,300+ members strong and growing. We also have seven generous volunteers who will be Community Managers, starting tomorrow.
If you’d like to discuss this week’s piece, join us in the #digitalnativediscussion channel today.
With that, on to this week’s piece…
Follow the Money: Categories of Consumer Spend
Despite a rocky economy, consumer spending is going strong.
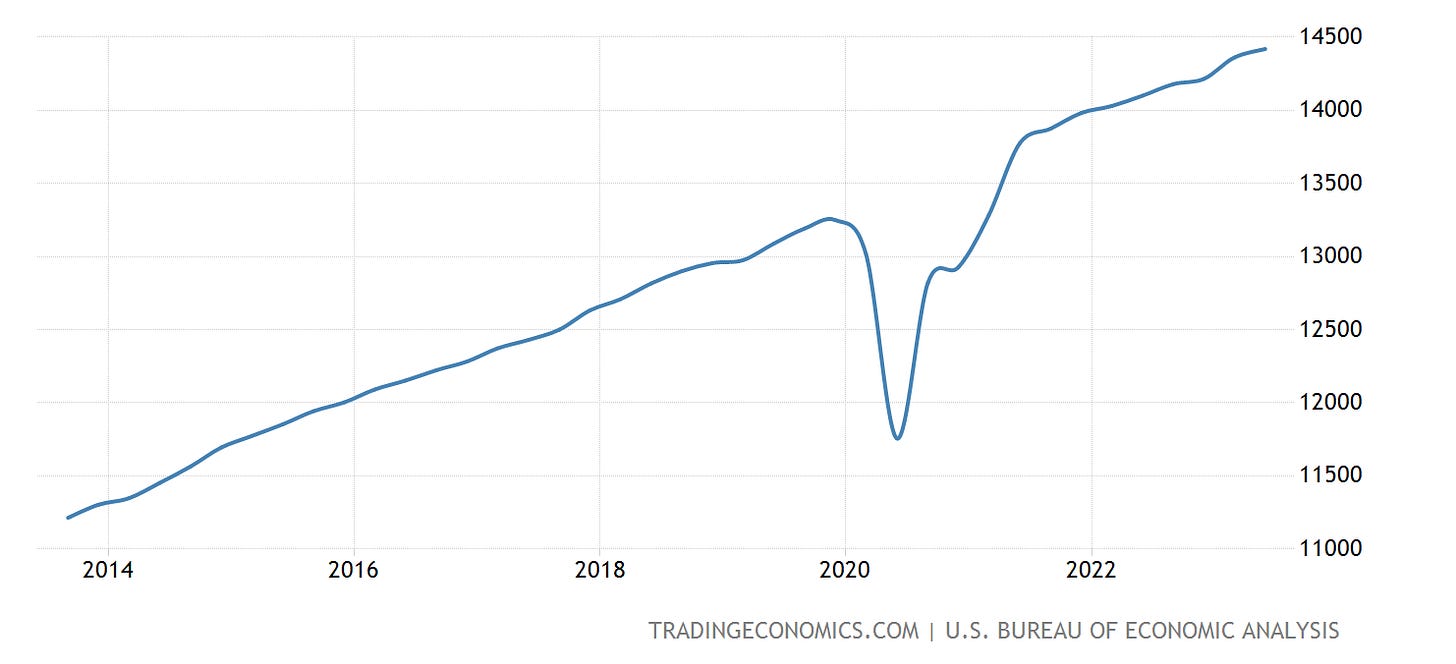
Even amidst high inflation rates in 2022, even with the S&P 500 dropping -19.64%, people kept spending. A Bank of America study found that credit and debit card spending rose +5.9% in 2022. The chart below commits an egregious Y-axis crime—starting at 11,000?! come on!—but it’s helpful nonetheless. After a COVID dip in 2020, spending rapidly rebounded and has been rising steadily. (The Y-axis is in billions, by the way, and shows quarterly data—consumer spending last quarter was about $14.5 trillion.)
A lot of headlines in the media tell the same story—that of the broke Millennial. But as Jean Twenge pointed out in The Atlantic recently, this narrative is wrong; Millennials are actually thriving.
It was true that the 2008 Great Recession was hard on Millennials: by 2012, the median household income of 25-to-34-year-olds had dropped 13% from its peak in 2000. But the 2010s brought a strong rebound. By 2019, Millennial households were making more money than households headed by Boomers or Gen Xers at the same age. Data from the U.S. Census showed that the median Millennial household brought in $9,000 more a year than the median Gen X household at the same age, and $10,000 more than the median Boomer house at the same age (inflation-adjusted, in 2019 dollars).
It’s true also that there’s a growing gap between those with a college education and those without—but there are fewer high-school-only graduates among Millennials. Millennials are the first U.S. generation in which more than 1 of 3 members hold a four-year college degree by their late 20s (for Gen Xers it was 1 of 4); 2 of 3 Millennials have attended college for at least a year.
Here’s how wealth looks by age for each generation—Millennials (and Gen Zs) are tracking closely to prior generations.
My unscientific, armchair-economist view is that comparison is at the root of the narrative we so often hear. Comparison comes in two forms. First is comparison to older, wealthier generations. Many resources in today’s market are supply-constrained—housing is the most obvious example, but products like cars and concert tickets are also increasingly scarce and increasingly sought-after (with COVID-reduced supply and COVID-induced demand). Look how much wealthier older generations are in the chart above; when older Americans can scoop up expensive goods like homes and cars and Eras Tour tickets, it leads to comparison and frustration among younger generations.
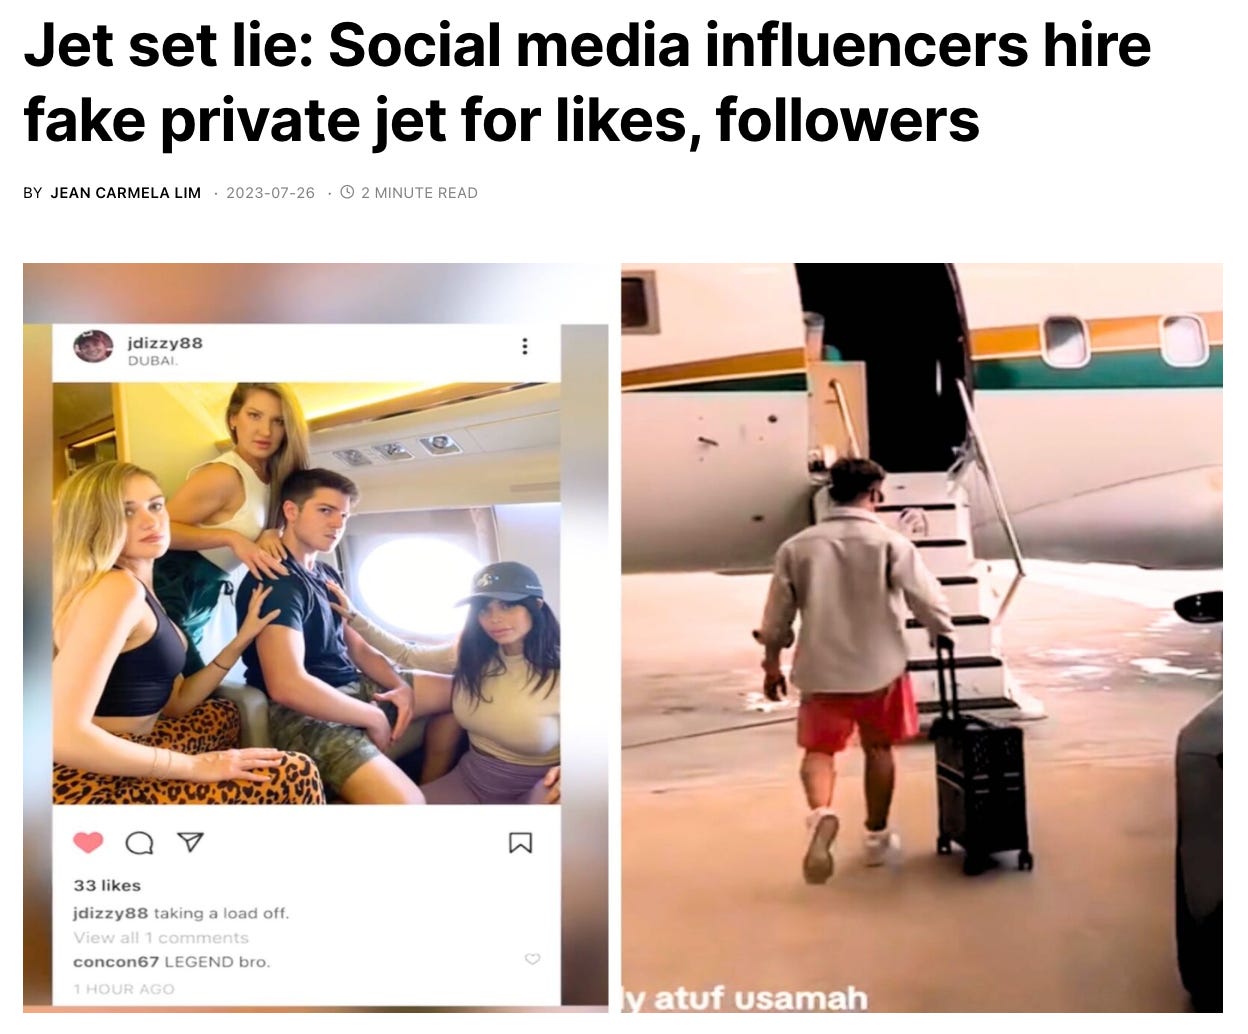
Second, and likely even more acute, are comparisons within generations. Prior to social media, it was difficult to compare yourself to those with more wealth; we might read about them in the paper or see them on TV, but that was about it. Now, it’s easy. We’re all inundated by a tsunami of content designed to make us feel less well-off.
Long story short, the American consumer is doing well—and, contrary to the popular narrative, that well-being extends to younger Americans. So if everyone is spending healthily, what are they spending on?
One of my most reliable frameworks for startup investing is a simple one: follow the money 💰 (Cue Jerry Maguire: “Show ME the MONEY!”) What are people spending their money on? What categories comprise a large portion of household spend, and as a result offer large markets for startups to build in?
Looking at the breakdown of an average U.S. household’s expenditures, a few categories stand out: housing, transportation, food, finances, healthcare, entertainment, apparel.
Each category holds a number of opportunities for innovation and disruption. There are consumer-facing opportunities, sure, but also B2B businesses being built to power the infrastructure behind large pockets of spend.
This week’s piece will dive into four categories—
Housing
Experience Economy & Travel
Pets
Shopping
In a future piece, I’ll dig into a few more: Transportation, Food & Alcohol, Healthcare, and so on.
These examinations aren’t comprehensive, but rather analyses of some interesting trends in each category, trends that are top of mind for me right now.
Let’s jump in 👇
Housing 🏡
In the “Millennials are broke” trope, most attention focuses on one facet of wealth: homeownership.
But Twenge points out that Millennial homeownership rates in 2020 were also similar to Boomers and Gen Xers at the same age: “50 percent of Boomers owned their own home as 25-to-39-year-olds, compared with 48 percent of Millennials, hardly a difference deserving of headlines or social-media memes.”
This doesn’t mean that homeownership in 2023 is easy. Mortgage rates have (finally) increased after years of (very) low rates, and home prices have shot up post-COVID. Here’s FRED’s house price index for New York, where I live:
Many of the Millennials counted in Twenge’s stat above may be older Millennials—Millennials who bought homes in the early 2010s, after prices dropped in the Great Recession, and then enjoyed a decade of enviable appreciation on those homes. For younger Millennials and for Gen Zs, things look a little more difficult right now.
There are interesting startups building in the broader housing swath of spend. Many help with home ownership—Summer with second homes, for instance, or Snapdocs with mortgage closing. But there are also startups tackling housing spend beyond homeownership.
One compelling company for those who can’t yet own: Bilt Rewards lets you earn points on rent.
Using Bilt, you can earn points while paying your rent that can then go toward travel, workouts, or even forging a path toward homeownership; Bilt partners with SoulCycle, American Airlines, and various other companies. It’s a clever idea and clearly attacks a salient painpoint for consumers. (Like most cards, Bilt earns revenue from interchange fees, as well as referral fees with its partners.)
Experience Economy & Travel 🎟
2010s social media gave birth to the so-called “Experience Economy.” A few years ago I wrote:
Instagram got its start as a literal filtered version of reality. It was a highlight reel—a place to showcase your life with a glossy sheen. And as one of the first mobile-native social apps, Instagram was always with us; social media became 24/7. The app catalyzed the “Experience Economy”—80% of Millennials said they’d rather spend money on experiences than on things. Symbols of status shifted: a Coach bag became an Instagram photo from Coachella.
When I think of peak Experience Economy, I think of the Museum of Ice Cream raising $40M at a $200M valuation in 2019. And while COVID decimated experiences in the short-term, they’re back with a vengeance; we may not yet have reached peak Experience Economy, after all.
Taylor Swift’s Eras Tour and Beyoncé’s Renaissance Tour are both shattering records, each on track to gross over $1B and to usurp Elton John’s Farewell Yellow Brick Road Tour as the highest-grossing tour in history.
Travel, meanwhile, is surging: as airfares rose faster than inflation, the International Air Transport Association declared earlier this year that they now expect airlines to boast $9.8B in net income this year, more than double the amount initially forecast. Global tourism will hit 95% of pre-pandemic levels in 2023, up from 63% in 2022. Airbnb revenue in the quarter ending June 30th was $2.5B, +18% year-over-year; last-twelve-months revenue in the period ending June 30th was $9.1B, +23% year-over-year.
The Experience Economy, though, is largely dominated by much-loathed incumbents. Ticketmaster is the subject of much ire—particularly after the Taylor Swift ticket debacle—but the company continues to own the market; its parent, Live Nation, is a $20B market cap business. Travel, meanwhile, belongs to the OTAs (online travel agencies): Booking Holdings (which owns Booking.com, Priceline, Kayak, etc.) boasts $20B in revenue and a $109B market cap; Expedia Group (which owns Expedia.com, Hotels.com, VRBO, Orbitz, etc.) boasts $12B in revenue and a $15B market cap.
(To digress for a minute: the reason Booking trades much higher than Expedia is due to margins—Booking has 23% profit margins compared to Expedia’s 7%. How can margins be so different for similar businesses? Expedia competes mainly in America, while Booking dominates Europe. America’s hotel market is dominated by powerful chains like Marriott and Hilton, which have strong bargaining power and resultingly cut down Expedia’s commission. Europe’s hotel market, meanwhile, is fragmented and made up of primarily independent hotels; this gives Booking more power and thus higher commissions.)
Back to the point: dominance by incumbents creates opportunity for disruptors.
We’re beginning to see some innovation in these stale, massive categories. Alex Rodriguez and Marc Lore (founder of Jet.com), for instance, are behind a new ticketing startup called Jump that aims to take on Ticketmaster. Safara, meanwhile, is a startup taking on the OTAs.
Whenever I find myself on Booking.com or Expedia.com or Hotels.com, I find myself thinking: this feels like an early-2000s internet experience. Everything is clunky and unfriendly to the end user; we’re forced to wade through pop-up ads and spammy deals. Clearly, there’s an opportunity to innovate.
Safara aggregates top hotels into an intuitive, well-designed app—then it gives users 10% cashback on bookings. The idea is to take on the OTA Goliaths with a simple, consumer-friendly app.
AI will clearly offer another opportunity in travel—the travel agent industry was already disrupted by the OTAs, but what happens when someone can say, “Book me a one-week trip to Paris and stay within my $200-a-night budget” and have an AI travel companion seamlessly carry out the booking? We’re already seeing AI trip planners like Tripnotes.ai and Wonderplan.ai promise personalized itineraries; other companies go B2B, like Amelia.ai offering hotels and resorts an AI companion for guests. Soon, everyone will have a copilot for every aspect of their trip.
Over time, experiences will become more convenient, more affordable, and more delightful to the end user.
Pet 🐶
“Pet” isn’t a slice of the household spend pie chart above, but in my view, pet is consistently one of the best investment categories. Why? Well, people love their pets. And they spend a lot of money on them.
Over the past decade, we’ve seen the emergence of the “fur baby” phenomenon. More Americans are waiting longer to have kids; this drives increased pet ownership and increased willingness-to-spend on pets. More U.S. households have pets than kids (85M vs. 35M) and 80% of pet owners say they treat their pets like their own children.
The “fur baby” effect is real: it’s the reason that pet spend is recession-resistant and actually increased throughout the Great Recession. It’s the reason that there’s an article titled “Six Reasons to Massage Your Dog”, complete with this image:
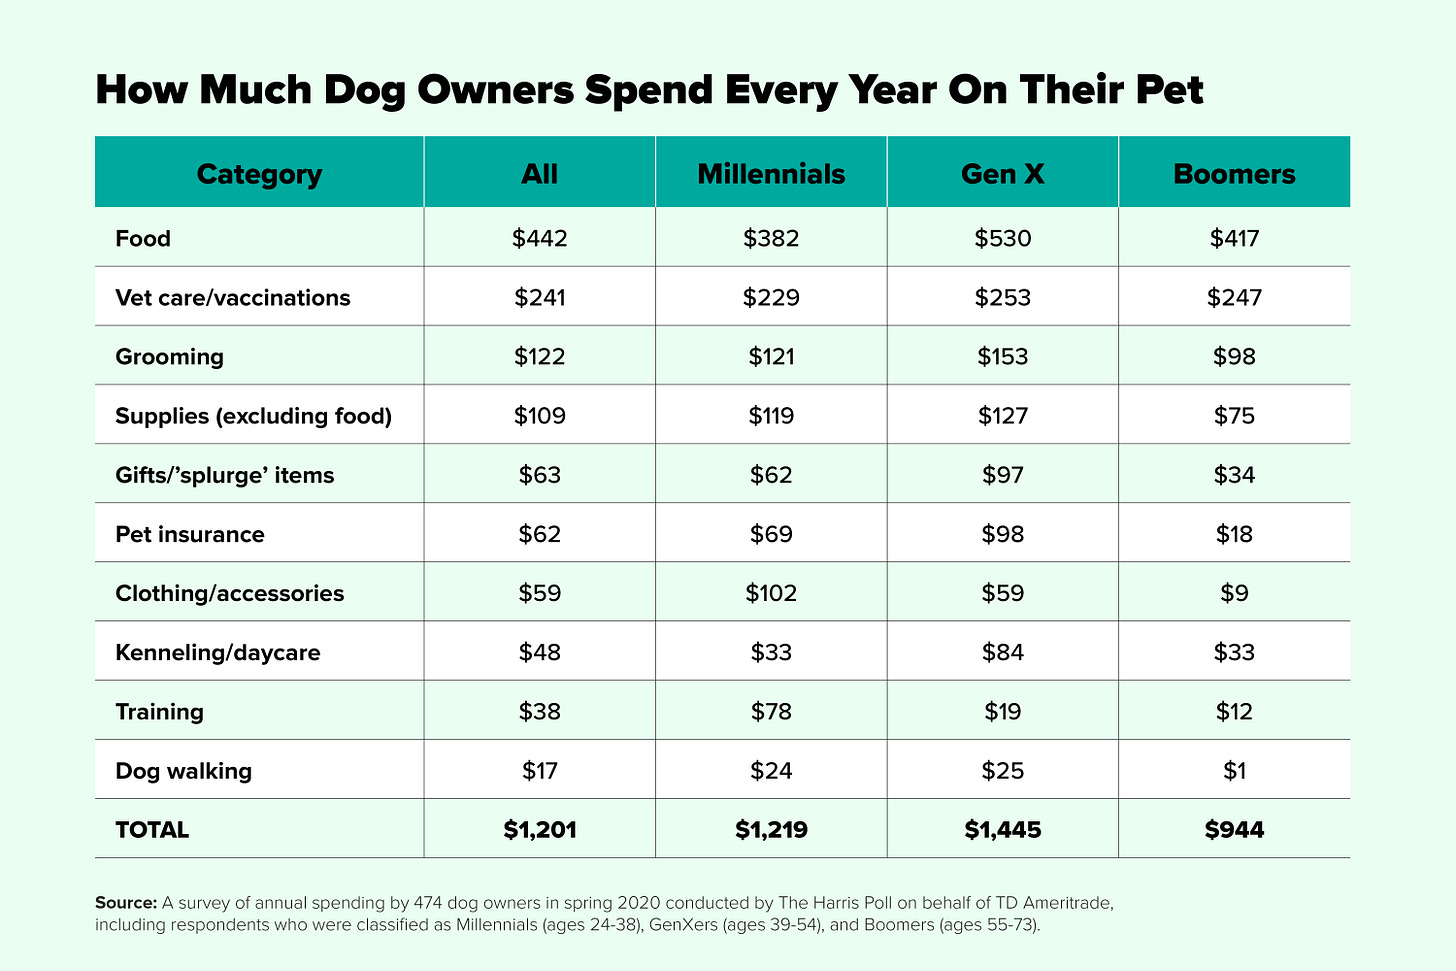
In 2022, Americans spent $137B on their pets, +11% from 2021’s $124B. From a founder and investor perspective, there are various subcategories within pet to capture this spend:
There’s food, a massive portion of spend. Startups like Farmer’s Dog are shockingly large businesses, well into the hundreds of millions in revenue. (Farmer’s Dog boxes litter my apartment building’s lobby.) There’s vet care, with startups like Modern Animal modernizing the category. There’s dog walking, with Rover and Wag the classic “Uber for X” startups within that category. (Both have suffered from disintermediation in their marketplaces, as well as negative headlines about dogs going missing or dying under a walker’s care.) And there’s pet insurance, which only has 3% penetration in the U.S. but is incredibly popular in Europe; that sounds like an opportunity, and startups like Fursure are capitalizing on it.
There are also B2B startups enabling the pet category to move into the 21st Century. Goose, for instance, is vertical software for the pet services category. Services—think daycare, grooming, and pet wash—are a fast-growing portion of pet spend. There are thousands of pet service providers nationwide, yet their tech stacks live in the stone ages. Goose aims to change that.
“Pet” is an attractive category in that it’s large, growing quickly, and uniquely emotional for both consumers and service providers. This creates various opportunities to bring pet into the 21st century.
Shopping 🛍
Americans love to shop. The average American household spends about $1,500 on clothing each year. Americans also spend $314 per month on impulse purchases, a dramatic increase from $276 in 2021 and $183 in 2020. (On TikTok, the “treat yourself” phenomenon has caught on; people are encouraged to pursue self-care through retail therapy.) Zooming out, retail is a $27 trillion (!) global market, still early in its online penetration.
There are two trends that have been interesting me lately in how people shop: (1) the rise of creator brands, and (2) the rise of discount shopping apps.
Many of the biggest brands in recent years are creator-led. People are translating their trust from monolithic corporate brands (e.g., L’Oreal) to personality-led brands (e.g., Rihanna’s Fenty) that are more emotionally-resonant. Creators lend brands a distribution advantage in an age of rising customer acquisition costs. (That said, many of the best brands pursue traditional go-to-markets as well—Rihanna’s Fenty partners with Sephora, for instance, while Mr. Beast’s Feastables sells in Walmart.)

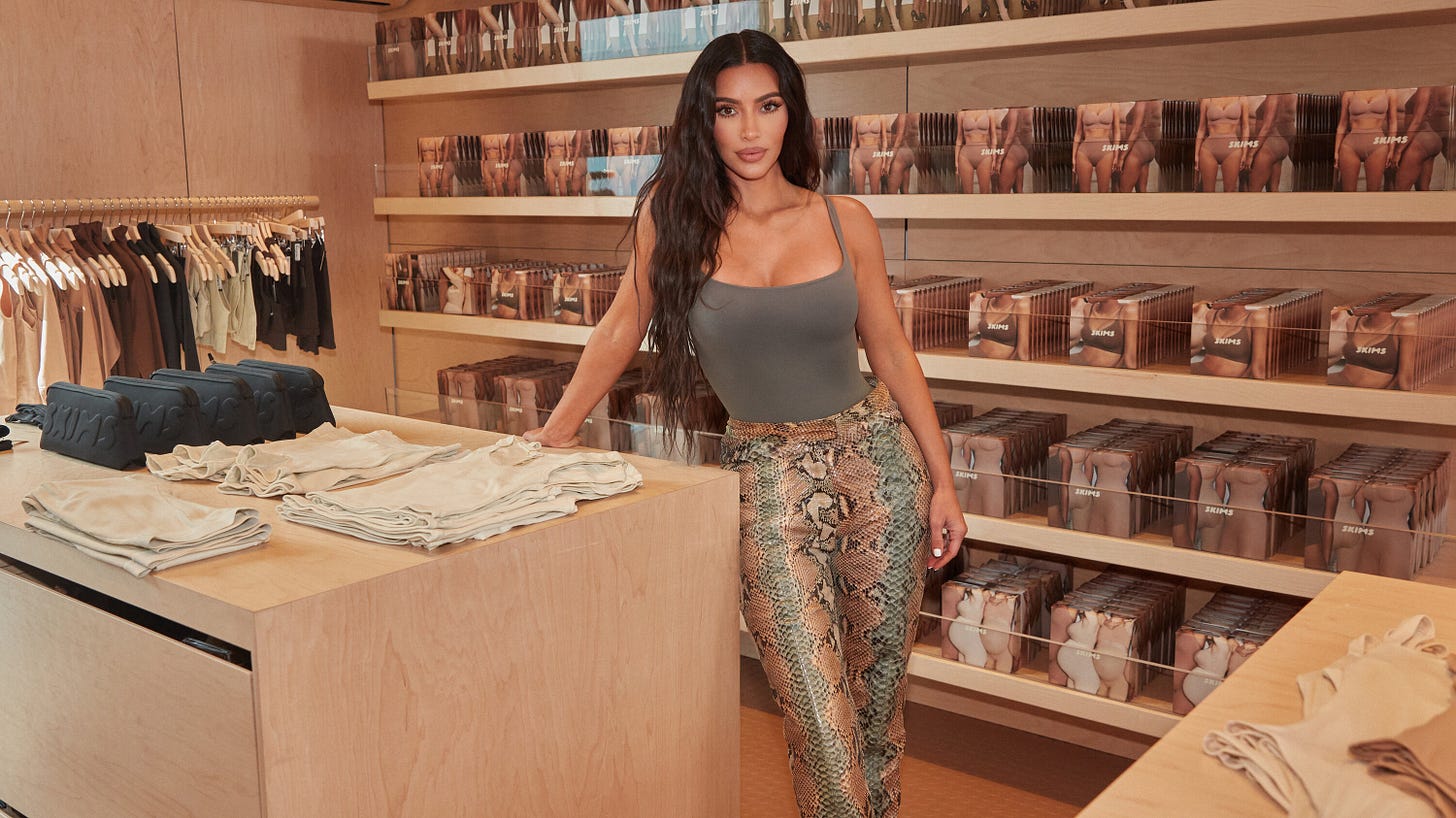
The creator/celebrity brands that endure do three things right: 1) They’re authentic to the celebrity, 2) They have a genuinely unique insight, and 3) They move beyond the celeb figurehead. The two most successful examples, in my mind, are Rihanna’s Fenty and Kim Kardashian’s SKIMS. Their unique insights:
Fenty: Make-up should come in more shades for people of color.
SKIMS: Shapewear is outerwear.
Both are raking in hundreds of millions in revenue. They injected new energy into stale categories. SKIMS just raised at a $4B valuation last month.
Other examples continue to fly under the radar—MrBeast’s Feastables and BeastBurger, for instance, are both doing huge numbers. Logan Paul’s and KSI’s PRIME, meanwhile, is posing a serious challenge to Gatorade. The sports drink is reportedly raking in over a hundred million in sales after launching just last year.
(Much of PRIME’s marketing is savvy; for instance, at one meet-up, Logan Paul and KSI urged fans to throw bottles at their heads in fake anger. As the creators knew it would, the media picked up the story and generated tremendous earned media value for the stunt. Brilliant 🤌 )
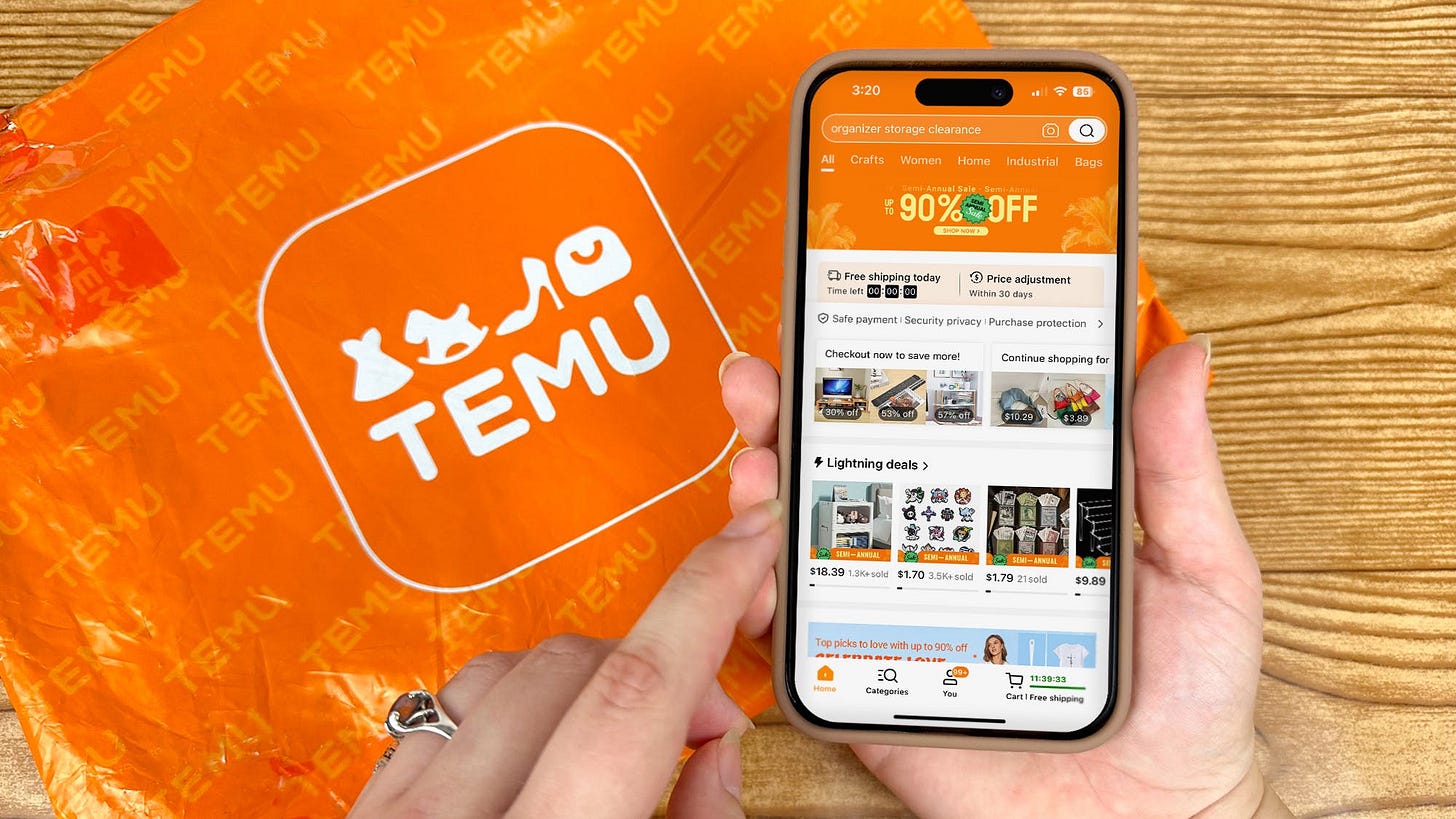
While creator-led brands flourish (when well-executed), shoppers also gravitate toward a quite different approach to shopping—cheap, effectively brand-less goods from discount e-commerce stores. China’s SHEIN and Temu are dominating here: either SHEIN or Temu is the most-downloaded app in half of the world’s 50 largest economies.
Earlier this year in The Retail Revolution, I wrote about the rise of discount retail: the top six retailers opening stores in 2022 were all dollar chains and discounters, led by Dollar General, Family Dollar, and Dollar Tree. In 2021, nearly 1 in 3 new chain stores opened in the U.S. was a Dollar General. The startup equivalent is Temu, effectively an online dollar store, which is owned by the Chinese e-commerce giant Pinduoduo.
In December, just four months after launching, Temu had more unique visitors than SHEIN and Wish. eMarketer reported that during the holiday shopping season, Temu ranked 12th in traffic among US retailers, wedged between CVS (#11) and Walgreens (#12). Temu came in ahead of major retail sites like Nordstrom, Wayfair, and Kohl’s.
Pinduoduo is following the Bytedance playbook of spending aggressively on user acquisition to win the U.S. market. Part of that plan included not one, but two Super Bowl commercials (costing $7M apiece). The strategy seems to have worked: Temu saw a 45% surge in downloads and a 20% uptick in daily active users on the day of the Super Bowl.
The question for Temu is whether it can 1) keep momentum, and 2) make its unit economics work. It’s hard to profit on shipping a bunch of $1 items from China to America. But early data is (surprisingly—to me at least) promising: spend retention on early Temu cohorts shows that shoppers spend ~50% of initial month GMV in their second and third months. For SHEIN, that figure is closer to 20%.
Not to be outdone, SHEIN is now doing over $30B in GMV; 2022 was its first year under 100% year-over-year growth in 8 years (!).
Anecdotally, I’m seeing more backlash to low-priced, fast-fashion-like apps like SHEIN and Temu, particularly among Gen Zs who feel torn between a good deal and doing what’s right for the environment. But the SHEIN-Temu duopoly is still the story of the year in e-commerce.
Final Thoughts
In a future piece, we’ll dig into what’s happening across other major categories of spend: Healthcare, Education, Financial Services, Transportation, Food & Alcohol.
When in doubt, follow the money.
See you next week, and in the meantime, we’ll be discussing this piece in the Discord #digitalnativediscussion channel. See you there.
Sources & Additional Reading
The Myth of the Broke Millennial | Jean Twenge
Related Digital Native Pieces
Thanks for reading! Subscribe here to receive Digital Native in your inbox each week:


