10 Charts That Capture How the World Is Changing (October 2023)
From OnlyFans to Obesity Drugs, Luxury Commerce to 3D Content
Weekly writing about how technology shapes humanity and vice versa. If you haven’t subscribed, join 50,000+ weekly readers by subscribing here:
10 Charts That Capture How the World Is Changing
It’s been a few months since I’ve done a “10 Charts” piece, so we’re back at it. You know the drill: we’ll look at 10 charts that capture how the world is changing. I’ve always been a visual learner, and charts help me process information. They’re also efficient at communicating important trends.
The charts this week capture a wide range of themes that I’m following and investing behind with Daybreak. We’ll cover—
Employee Productivity
OnlyFans and Digitally-Native Entrepreneurs
Healthcare Expenditures
The Rise of Obesity Drugs
Satellites in Orbit
Temperature Anomalies
Gen Z, Luxury, & Sustainable Commerce
Gen Z & LGBTQ+ Identity
Exponential Technology
The Rise of Vision Pro & 3D Content
My hope is that this is an engaging way to visualize how the world is changing.
Let’s jump in 📈
1️⃣ Employee Productivity
Employee productivity is improving dramatically; in other words, companies are able to do more with less. The average number of workers at an S&P 500 company needed to generate $1M in top-line has halved from four in 2000 to two today:
This is the result of rising average worker productivity: technology has allowed each worker to get more output per hour worked. Today, the average worker drives ~$70+ of GDP per hour worked, continuing a decades-long trend upward:
Neither of these charts factors in AI, which should further amplify worker productivity. Last week’s piece on LLMs explored how LLMs are increasing knowledge worker performance. From that piece:
Consider a study out of Harvard Business School on how LLMs amplify consultants’ performance. In the HBS experiment, consultants randomly assigned access to GPT-4 completed 12.2% more tasks on average and worked 25.1% faster. Quality improved by 40%.
These tools perhaps should be priced in accordance with their value. A junior McKinsey consultant runs clients $67,500 per week on average. If an AI tool improves that consultant’s output by ~25%, should it be priced at $17K per week? Pricing that high is unlikely, but it will be interesting to see how these tools price; old world per-seat SaaS pricing might need to be revisited.
As I argued last week, this won’t change the number of hours worked. In 1930, the economist John Maynard Keynes predicted that his grandkids would work a 15-hour workweek. By the 21st century, he said, we would work Monday and Tuesday, then have a five-day weekend. What Keynes missed was that work is as much a product of culture as it is of technology. And work has increasingly become the foundation of culture; as Derek Thompson put it so elegantly: “Here is a history of work in six words: from jobs to careers to callings.” It’s easy to give up a job; it’s harder to give up a calling.
The result from AI will be that worker productivity (measured as GDP per hour worked) will surge, but hours worked will remain the same—or even increase slightly.
The other offshoot of the rise in worker productivity—magnified by AI—may be an increase in capital-efficient startups. Over the past decade, the markets rewarded growth over profitability. That’s now changed. Late-stage investors in recent exits like Instacart ($7B market cap after an IPO last month) or Loom ($975M acquisition by Atlassian last week) saw poor returns. Early investors, meanwhile, saw heavy dilution.
Now, companies can get more done with fewer people. Building blocks like AWS, Stripe, and Langchain help you get going. Affordable software products, and now AI products, help workers get more out of each hour of work. In the future, we might see more startups raise an initial round of Seed funding, then grow efficiently from there. There’s a lot you can do with a talented team, a few million bucks, and a suite of technology tools.
This is another downstream effect of improved worker productivity: better returns for Seed investors, for founders, and for employees.
2️⃣ OnlyFans and Digitally-Native Entrepreneurs
OnlyFans is a monstrous business. The company recently reported that revenue topped $1B in 2022, with $525M in profit. (OnlyFans takes a 20% cut of subscriptions and micropayments on its platform.)
There are now 3.2M OnlyFans creators, up 9.2x from the pre-pandemic figure:
Of course, there’s a reason OnlyFans has grown so rapidly: sex sells. When we use the framework of the Seven Deadly Sins for consumer technology, few companies more closely embody a sin than OnlyFans, which represents Lust. The latest data shows that 98% of OnlyFans content is adult content (though some research contests that it’s “just” 70%).
What the rise of OnlyFans more broadly represents, though, is the rise of the digitally-native entrepreneur. This is a trend I’ve written about many times: younger people’s desire for more flexible, autonomous, and economically-rewarding work.
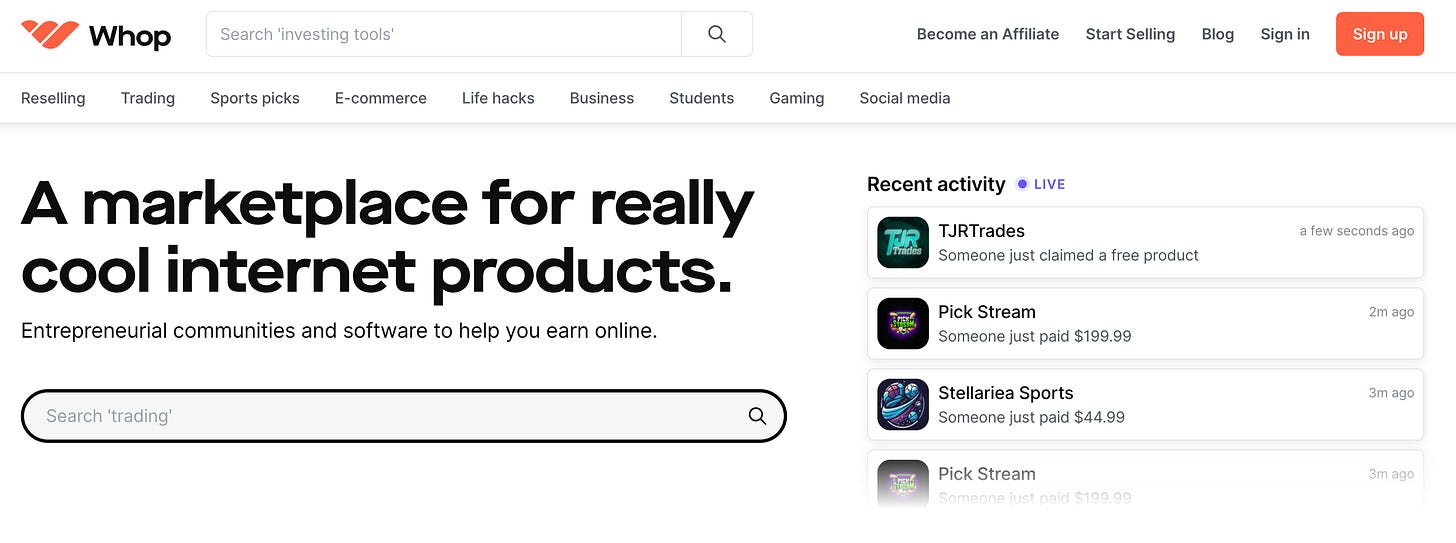
OnlyFans is an extreme example, but we see other platforms underpin new work ecosystems. Whop is one interesting example, acting as infrastructure for “internet entrepreneurs”—people selling sneaker bots, IP proxies, community memberships, and any other digital product.
We see other examples in small-business retail (Flagship), in-game development and modding (Overwolf), and expert networks (Office Hours), to name a few categories.
More and more people will earn a living without leaving their living room.
3️⃣ Healthcare Expenditures
Few charts better capture the U.S. healthcare system than this one:

Yikes.
We spend more per capita on healthcare than any other country, yet health outcomes in the U.S. are abysmal. Digital health continues to be an interesting area of innovation, though distribution can be challenging: startups have to weave through a labyrinth of patients, providers, and payers. But we’re seeing promising early-stage companies emerge across categories: Prosper Health (autism care), Summer Health (pediatric care), Roon (Glioblastoma and ALS), to name a few.
One of the most successful go-to-markets I see in healthcare is what I call “B2C2B.” Start by building a best-in-class consumer-facing product. Go directly to consumers and build enough scale to prove health outcomes. Then use those early proofpoints to sell B2B into employers and health systems—where the real money is and where the unit economics are more favorable.
4️⃣ The Rise of Obesity Drugs
Here’s a fascinating stat: Levi’s CEO said last week that 40% of people had a change in waist size from the pandemic.
In March’s 10 Charts piece, I wrote about the rise of obesity treatment drugs, also called GLP-1 agonists. That piece included this chart from The Economist:
The Economist estimates that by 2031, the market for GLP-1 drugs will be over $150B. For perspective, that’s on par with the market size for all the drugs used to treat cancer ($185B in 2021). I expect there will be various opportunities here for enterprising entrepreneurs—the drug companies will win, sure, but there will also be ecosystems of “Ozempic influencers” and “Wegovy coaches” and online managed marketplaces for access to weight loss drugs. (Ozempic is the name of the drug used to treat type 2 diabetes that also has weight loss effects; Wegovy is the name of the drug specifically prescribed for weight management.)
The size of the problem is clear. From January’s piece How Startups Are Combatting America’s Obesity Epidemic:
In 1990, zero states had obesity rates above 20%. In 2018, zero states had obesity rates below 20%.
Also mentioned in that January piece was Nourish, a marketplace matching you with a dietitian covered by insurance. Unsurprisingly, GLP-1 agonists have provided a massive tailwind in the dietitian space this year. Telehealth companies like Ro are also propelling widespread adoption of obesity drugs.
Over the past year, GLP-1 agonists have been on a tear. My friend Damir shared some interesting stats in his Evidence series:
Today, 4% of the U.S. population is taking a GLP-1 drug
Usage is growing 111% year-over-year
373,000 new prescriptions are written each week
I also liked this table that Damir shared, showing how Ozempic users change food and beverage consumption habits. Snack food takes the biggest hit. (GLP-1 drugs work by mimicking the action of a hormone called glucagon-like peptide 1, making you feel full; so being on the drugs, you literally feel full and satiated, and thus lose your appetite for food.)
Given that 40% of the world’s population is overweight or obese, there’s a lot of room for growth here. And the market will swell if insurers reimburse the cost, which seems likely:
A 5% reduction in weight can cut an obese person’s medical costs by $2,000 per year
A full transition from obesity to healthy weight saves nearly $30,000 in annual medical costs
Depression rates among obese children are double those of average-weight kids
The downstream effects are interesting to contemplate. Gyms may face shrinking memberships. Snack food companies are already bracing for a hit, and Walmart is reorienting its SKUs across product categories to reflect use of GLP-1 agonists. One wild effect: it’s estimated that United Airlines would save $80 million a year in fuel costs if its customers lost an average of 10 pounds.
The clear winner so far is Novo Nordisk, which makes Ozempic and Wegovy. The Danish company recently overtook LVMH as Europe’s biggest company.
5️⃣ Satellites in Orbit
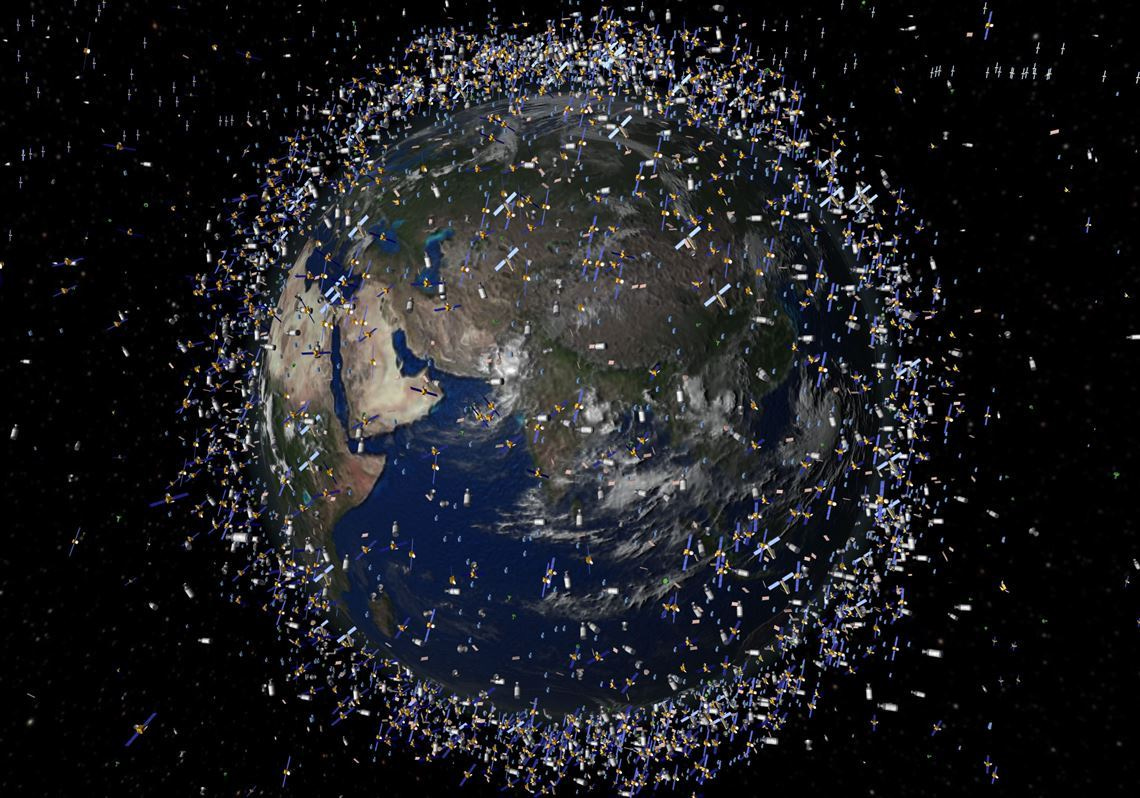
There are 7,702 satellites orbiting the Earth.
It might surprise you to learn that SpaceX has 3,395 satellites in orbit, 11x more than the U.S. government. As a country, the U.S. leads the world with over half of the world’s satellites; China is next with about 500 in total (369 government-owned).
Starlink, SpaceX’s satellite internet arm, continues to fly under the radar. Since launching satellites in 2019, Starlink has quickly become the world’s biggest satellite operator, now providing coverage to over 60 countries. The division of SpaceX promises “high-speed internet, anywhere on Earth.”
Cellular service is next. As of last week, Starlink Direct-to-Cell has its own website. Starlink will offer SMS services starting in 2024; voice and data support will come in 2025. Direct-to-Cell will work with any existing LTE phone—in other words: the phone you’re using right now—and will work anywhere on Earth. (By the way, this is how Apple’s Emergency SOS feature works—by sending limited messages and location data via satellite.)
A lot of focus has (rightly) been placed on SpaceX’s rocket launches. But Starlink is building something formidable and world-changing, one satellite launch at a time.
6️⃣ Temperature Anomalies
September was hot. As in, hottest-month-ever-recorded hot. By a large margin.
This chart shows temperature anomalies—in other words, how much hotter or cooler each month was relative to 1951-1980 averages. September was 1.47 degrees Celsius above that average.
Here’s another view, this time relative to the 1975-2023 window; September comes in 0.89 degrees Celsius above average, by far the greatest anomaly ever.
These charts are alarming. Climate change continues its rampage, and my view is that we’ll need to innovate ourselves out of this mess.
The good news is that climate tech funding is also surging: last year, as the broader funding market cooled, climate tech funding actually accelerated. According to HolonIQ, climate tech startups raised $70.1B in 2022, +89% year-over-year.
Much of venture funding is going into carbon accounting software and carbon credits markets, areas benefiting from favorable regulations and well-suited to venture-scale outcomes. A bigger question is whether more capital-intensive hardware segments of climate tech will be able to produce venture returns.
7️⃣ Gen Z, Luxury, & Sustainable Commerce
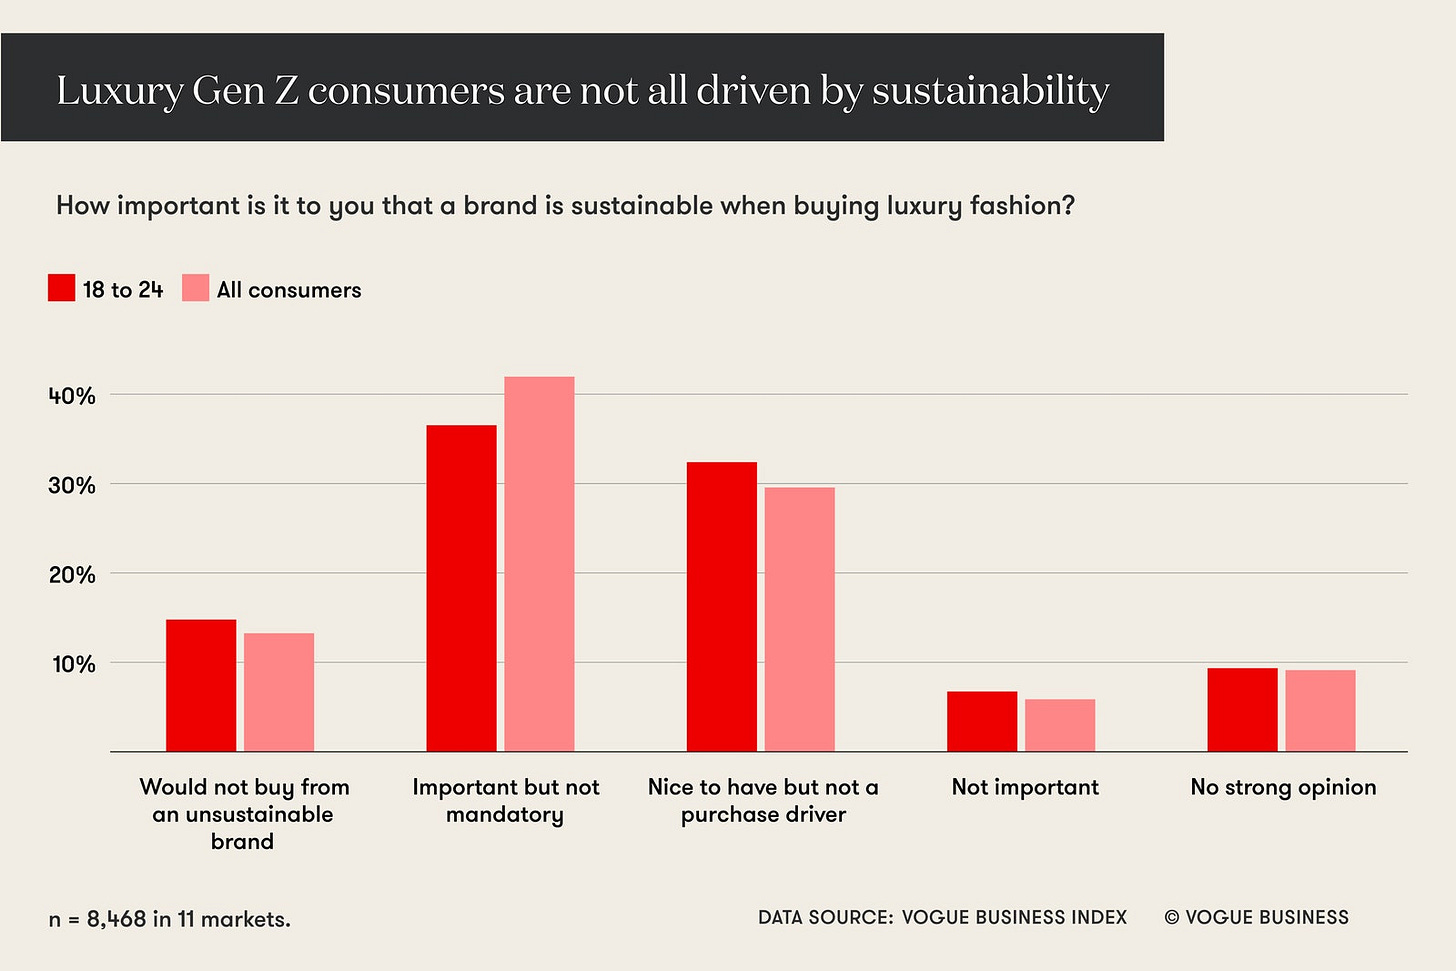
One offshoot of climate is the rise of sustainable commerce, an area that continues to interest me. The problem is: people seem to be more driven by either a good deal (e.g., Gen Z with their SHEIN hauls) or by a coveted product (e.g., luxury).
My view is that sustainable products will need to reach price and quality parity with non-sustainable products in order to win.
The intersection of Gen Z and luxury is also worth studying. Gen Zs, despite their age, love luxury. A report from Bain noted that the average Gen Z makes their first luxury purchase at age 15, three to five years earlier than the average Millennial.
What’s driving this? In my mind, a culture around “treating yourself,” which is rampant on TikTok. People buy luxury as a way to cope with a chaotic world they’re exhausted from—climate change, the pandemic, capitalism. This YOLO mentality, to put it in Millennial speak, has bled into purchase habits.
Luxury was on a tear the last few years, but that surge is finally coming to an end. LVMH last week announced weaker-than-expected revenue growth (just 9%, down from 17% a quarter ago), sending its stock plummeting. LVMH has led a sell-off that’s erased $245B from Europe’s seven biggest luxury companies in the last three months.
We’re finally seeing consumer spending slow slightly, with student loan repayments starting up again and consumers eating through savings built up during the pandemic. (The Fed predicted earlier this year that U.S. consumers would run out of savings in Q3.)
The result may be a hit to sustainability: people will seek a good deal, often at the cost of environmental impact. This increases the urgency for brands to reach price and quality parity for green products, and for startups to help retailers clean up their act in manufacturing and supply chain.
8️⃣ Gen Z & LGBTQ+ Identity
To continue with Gen Z for a moment: I’m fascinated by Gen Z’s LGBTQ+ identification. Among Millennials, LGBTQ+ identification hovers around 10%; among Gen Z, it’s twice that.
Here’s another view of that Gallup survey:
It’s impossible to say what the true figure is; sexual orientation is a spectrum. Gender and sexual identity are fluid. More startups are building specifically for this population. ForThem, for instance, is an e-commerce and content site for the queer population that started with selling chest binders to the trans population (solving the founder’s own personal problem).
But other startups are building on the generational trend here: more fluid identity and self-expression. That’s what interests me most.
Part of the sharp uptick above is cultural: it has become more acceptable to exist on the spectrum, to not be black-or-white, in-or-out. This cultural shift goes beyond LGBTQ+ to self-expression in general. We see this in how people design and dress avatars in game worlds; we see this in how people embrace vTubers (virtual YouTubers) on Twitch; we see this in how people create entire new characters to embody in online destinations like NoPixel, Grand Theft Auto’s roleplay server.
For a younger generation, identity is becoming more complex, contextual, and nuanced. The internet enables these multi-faceted forms of identity.
9️⃣ Exponential Technology
It’s sometimes difficult to wrap our heads around the pace of technological improvement. From last week’s piece:
Large language models have improved rapidly in recent years. To put their improvement in perspective, consider this analogy:
If air travel had improved at the same rate as LLMs, average flight speed would have improved from 600mph in 2018 to 900,000mph in 2020—a 1,500x increase in two years. Instead of taking eight hours to travel from London to New York, it would take just 19 seconds (!).
Of course, air travel exists in the world of atoms, while LLMs exist in the world of bits. This is why LLMs can improve exponentially, thanks to Moore’s Law. But the example of air travel is helpful in illustrating the sheer magnitude of advancement we’ve seen the past few years.
Exponential improvement is a powerful force. Here’s how the cost of computer memory and storage has decreased over time—notice the y-axis is shown logarithmically:
Here’s the same chart with a linear y-axis:
Similarly, Moore’s Law posits that the number of transistors that can fit into a microprocessor roughly doubles every two years. Here’s a chart of Moore’s Law, again shown logarithmically:
Here’s that same chart shown linearly:
Exponential technological improvement isn’t going anywhere. Think of the leaps technology has made in recent years, particularly with language models and image models. When you squint, you can imagine where we’ll be in 2030: immersive, rich, three-dimensional virtual worlds (perhaps delivered through a device like Apple’s Vision Pro), with nearly every pixel generated, not rendered. Most content online will be created by AI; in the past, I’ve called this the rise of user-generated generated content (UGGC).
The charts above make it easier to appreciate the difference that five or 10 years can make.
🔟 The Rise of Vision Pro & 3D Content
Speaking of Vision Pro and 3D content—
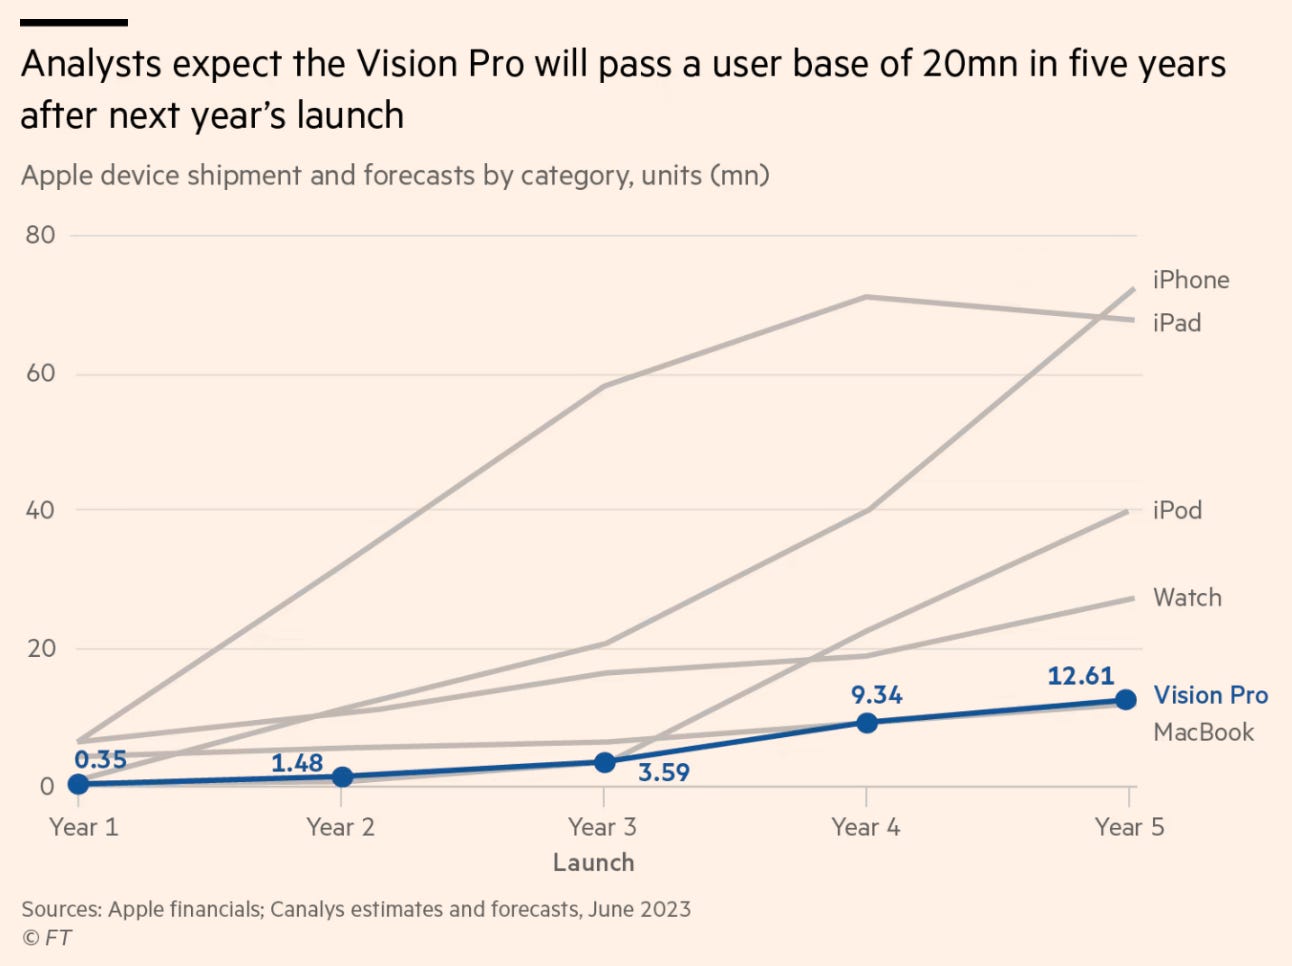
Here’s a chart of how analysts expect Vision Pro to sell:
20M units in five years puts the Vision Pro more on par with the MacBook than the iPhone. This makes sense; it’s more a luxury item rather than a mass-market necessity. I liken it more to a game console than to a mobile phone in terms of market size. But this may change as price comes down and quality improves.
More interesting to me is what application ecosystem forms because of Vision Pro. As I’ve shared many times in Digital Native, my view is that technology follows a reliable march from less-rich media formats to more-rich media formats. From summer’s 3D Content and the Floodgates of Production:
Vision Pro will usher in a generation of developers building immersive, 3D content. This content will find a home on Vision Pro, sure, but it will also be multi-platform. Roblox and Rec Room, after all, are popular across VR headsets, consoles, desktop, and mobile.
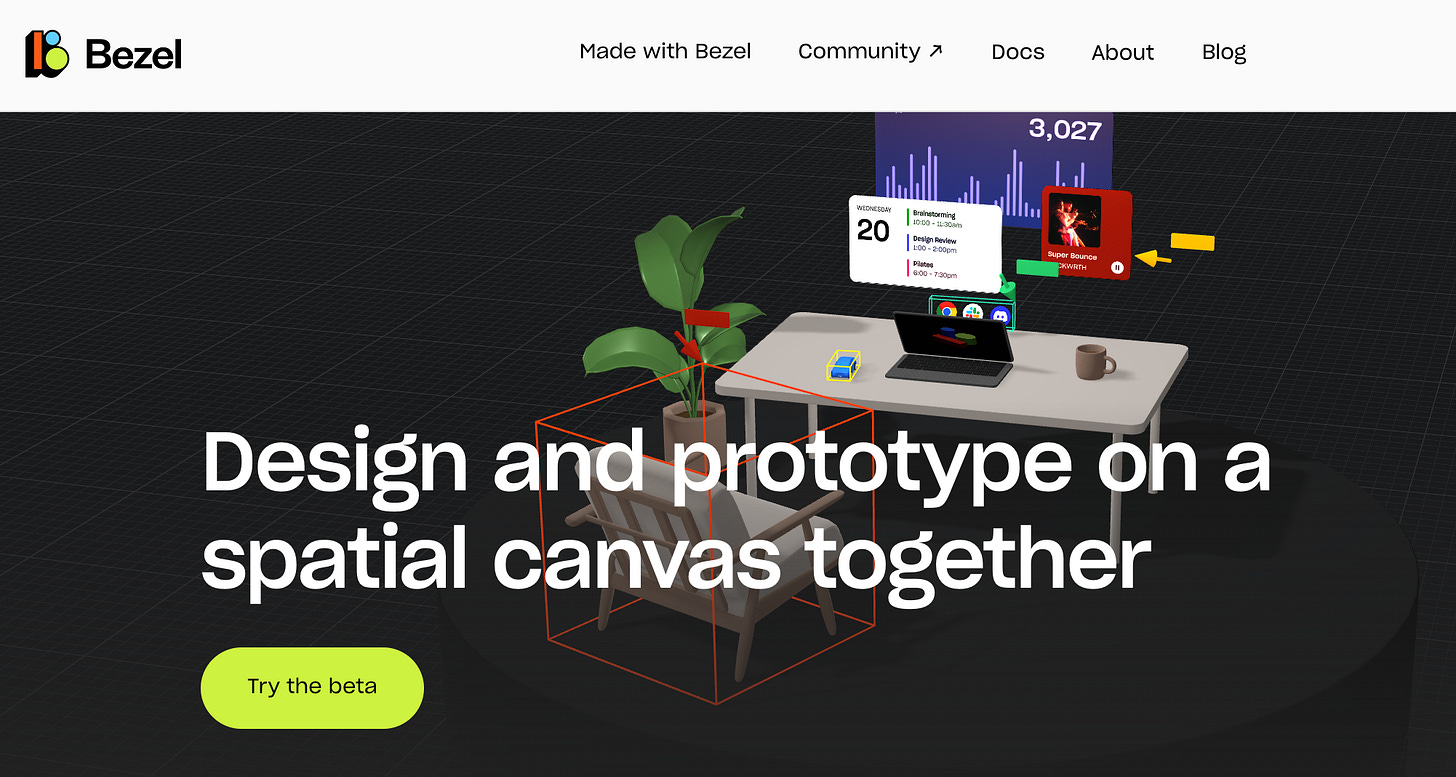
A new wave of 3D artists need picks and shovels. Companies like Bezel allow intuitive, cross-platform 3D design and prototyping.
In the words of the company:
What if designing in 3D was as easy as building a sandcastle with your friends? Imagine how freeing it would be to express your ideas together on a canvas as vast as the beach.
Crucially, Bezel doesn’t require you to know a single line of code. This is the arc of technology: more immersive digital experiences and more accessible creation tools.
Final Thoughts
I’ll do another “10 Charts” series this winter. In the meantime, I’d love to see any charts that you’ve been struck by. You can reply to this email, or send me a DM on Twitter at @Rex_Woodbury.
Until next week 👋
Related Digital Native Pieces: Past Installments of 10 Charts
10 Charts That Capture How the World Is Changing (July 2023)
10 Charts That Capture How the World Is Changing (March 2023)
10 Charts That Capture How the World Is Changing (November 2022)
10 Charts That Capture How the World Is Changing (November 2022)
Thanks for reading! Subscribe here to receive Digital Native in your inbox each week:


